Radio Galaxies
Chairs: Emanuela Orrú (ASTRON) and Marek Jamrozy (Jagiellonian University)
Giant Radio Galaxies
Giant radio galaxies are believed to be formed from relativistic jets of matter and energy, emanating from the central regions of active galactic nuclei. Synchrotron radiation, often polarized, from the radio jets and lobes of these objects will be studied with LOFAR. The low-energy electrons responsible for the low-frequency emission can propagate large distances from their origins in the central core or lobe hot spots, and large radio cocoons are expected to surround many objects. Using high angular resolution observations with the full international LOFAR array should help us to learn more about the low-energy electron population in these objects, and hopefully to better understand the acceleration mechanisms which produce the relativistic electrons responsible for synchrotron emission. The high degrees of polarization of giant radio galaxies makes them ideal polarization calibrators for the observation of weaker sources.
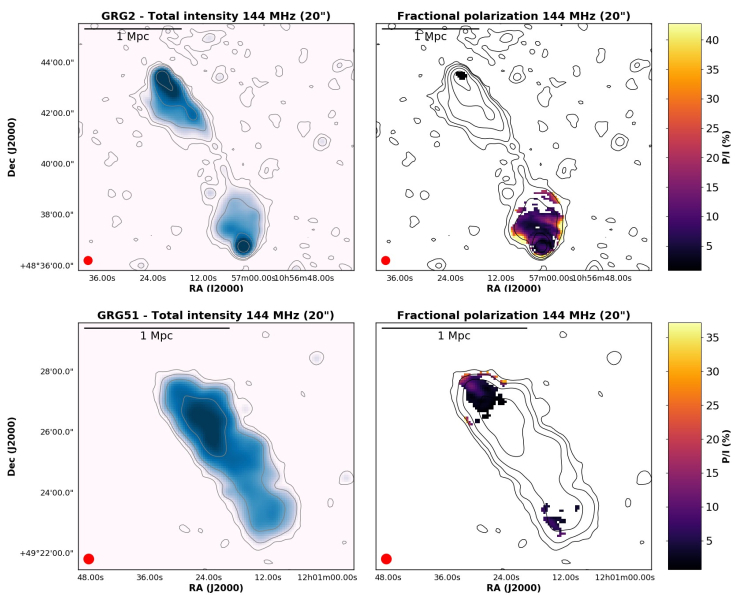
Using the polarization properties of a sample of giant radio galaxies (i.e. sources with a physical size of about 1 Mpc) we probed intergalactic magnetic fields outside galaxy clusters. (Stuardi et al. 2020)
NGC 6251
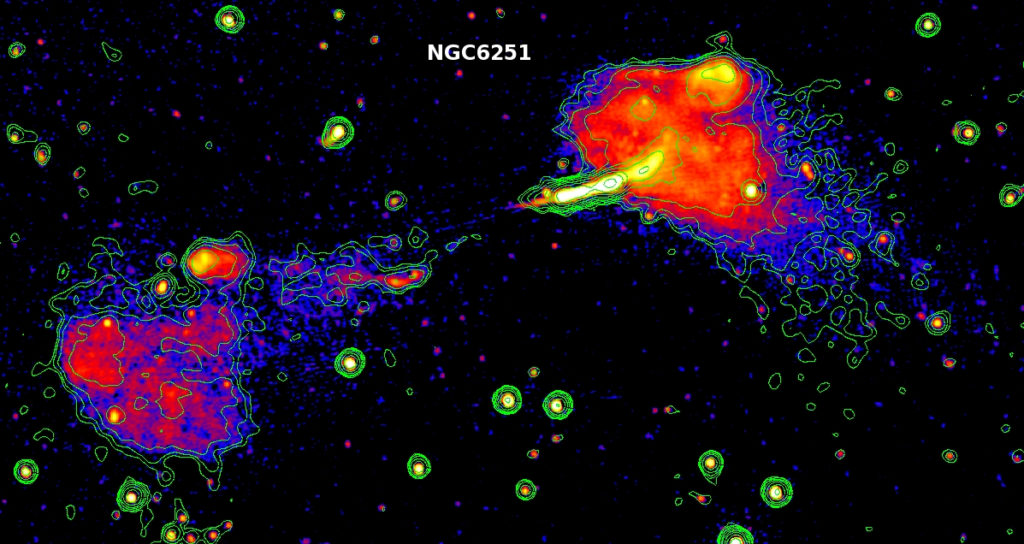
Total power radio map of the giant radio galaxy NGC 6251. Contours: WSRT 327 MHz data with resolution of 55″x100″ (from Mack K.-H., et al. 1997); colours: LOFAR DR2 143 MHz data with resolution of 20″x20″. See Cantwell et al. (2020).
Radio galaxy rotation measures
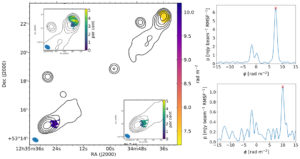
This image shows the Faraday rotation and degree of polarisation for the giant radio galaxy ILT J123459.82+531851.0, adapted from O’Sullivan et al. (2019). The main image shows the total intensity contours at 25″ with the colour-scale showing the Faraday rotation measure (RM) of the regions detected in polarisation. The two insets show zoomed-in regions on the NW and SE lobes, with the degree of polarisation shown with the colour-scale. The Faraday dispersion function (FDF) for the peak polarised intensities in the NW lobe (top) and SE lobe (bottom) are shown on the right. The red cross marks the peak of the source-related polarised emission. The other peaks are either noise peaks or related to the instrumental polarisation.
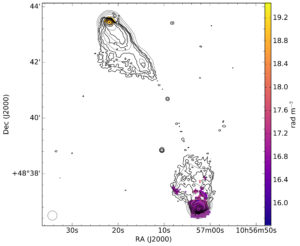
This is an image from O’Sullivan et al. (2018) showing the total intensity and Faraday rotation images of an FRII radio galaxy, ILT J105715.33+484108.6, in LoTSS-DR1 which has a projected linear size of ~1.9 Mpc. The grey contours and colourscale Faraday rotation measure (RM) images are at 20″ resolution (the convolving beam is indicated by the circle in the bottom left corner of the images), while the black contours are at 6″ resolution.