Milky Way
Chairs: Marco Iacobelli (ASTRON) and Vibor Jelić (Ruđer Bošković Institute)
Our Galaxy’s magnetic field is an invisible force that plays a role in many astrophysical processes across many scales and field strengths. The (magnetic) structure of our Galaxy is challenging to study because we are embedded within it. Despite advancements since the Galactic magnetic field was first theorised and observed over 70 years ago, there are many open questions concerning its 3D structure, origin, and evolution.
The Milky Way Working Group aims to increase our knowledge of magnetic fields in our Galaxy (and beyond!) using LOFAR, primarily through the following channels:
- Diffuse, polarized Galactic synchrotron emission and its Faraday rotation help us to explore the properties of the small-scale magnetic field inside our Galaxy, through applying a novel technique called Faraday tomography. This naturally enables collaboration with the other MKSP working groups because every target field is expected to show Galactic synchrotron emission.
- Faraday rotation measured towards polarized pulsars and extragalactic radio sources are an excellent probe of the large-scale Galactic magnetic field structure in 3-D. This work also enables collaboration with the other MKSP working groups – towards subtracting the Milky Way’s foreground from extragalactic signals from distant galaxies.
Published Work
Open allClose all[nba_button type="button-outline" size="small" link="https://ui.adsabs.harvard.edu/abs/2019A%26A...623A..71V"]Read the paper[/nba_button]
Faraday tomography allows us to map diffuse polarized synchrotron emission from our Galaxy and use it to interpret the magnetic field in the interstellar medium (ISM). We have applied Faraday tomography to 60 observations from the LOFAR Two-meter Sky Survey (LoTSS) to produce a Faraday depth cube mosaic covering 568 square degrees at high Galactic latitudes, at 4.’3 angular resolution and 1 rad m-2 Faraday depth resolution. We observed diffuse polarized emission throughout most of the field, with Faraday depths between -7 and +25 rad m-2, and many new polarization features, some up to 15 degrees in length. These include two regions with very uniformly structured, linear gradients in the Faraday depth. We also observed a relationship between one of the gradients and a neutral Hydrogen filament in the local ISM. We also checked other ISM tracers for correlations with our polarization data and none were found, although little signal was seen in most tracers in this region.
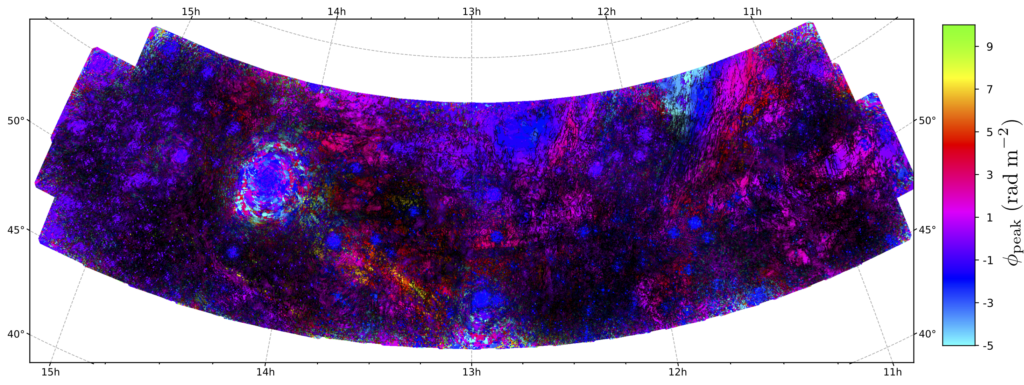
Collapsed view of the full mosaic, where the polarized intensities and Faraday depths of the brightest features in the Faraday spectra were used to determine the brightness and color, respectively. Instrumental leakage from bright point sources, particularly 3C295, dominate many areas with features at Faraday depths around −2 rad m−2, but diffuse emission can be seen through most of the mosaic.
[nba_button type="button-outline" size="small" link="https://ui.adsabs.harvard.edu/#abs/2019MNRAS.484.3646S"]Read the paper[/nba_button]
[nba_button type="button-outline" size="small" link="https://freshscience.org.au/state/wa/mapping-our-galaxys-magnetic-field"]Press release (Fresh Science)[/nba_button]
[nba_button type="button-outline" size="small" link="https://blog.csiro.au/communicating-science-to-a-fresh-audience"]Press release (CSIROscope)[/nba_button]
We determined Faraday rotation measures (RMs) towards 137 pulsars in the northern sky, using Low-Frequency Array (LOFAR) observations at 110-190 MHz. Overall, our initial low-frequency catalogue provides valuable information about the 3D structure of the Galactic magnetic field. We report RMs towards 25 pulsars for the first time. The RMs were corrected for ionospheric Faraday rotation to increase the accuracy of our catalogue to ≈0.1 rad m-2, improving the precision of existing RM measurements by a factor of 20, on average. We use these new precise RM measurements (in combination with existing RMs, dispersion measures, and distance estimates) to estimate the scale height of the Galactic halo magnetic field for Galactic quadrants I and II above and below the Galactic plane.
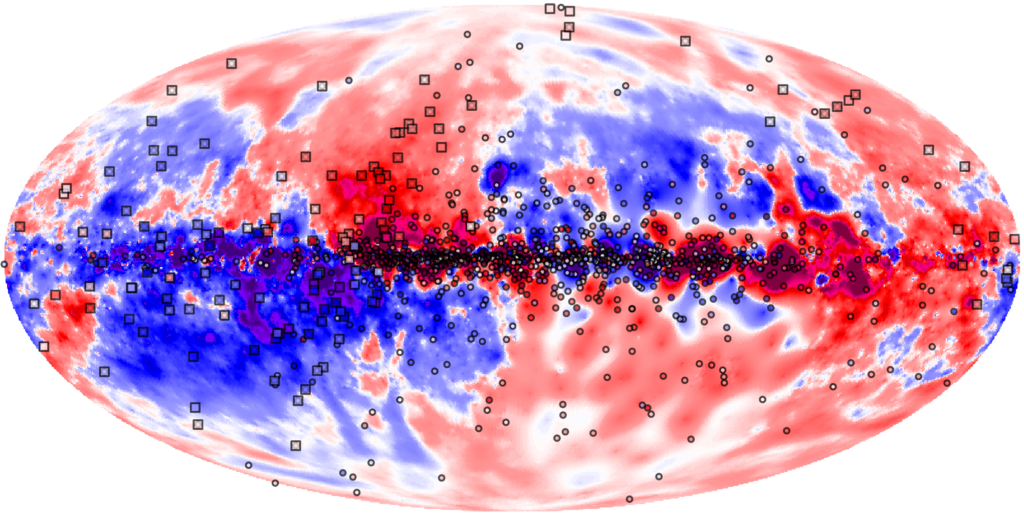
A representation of how our Galaxy would look in the sky if we could see magnetic fields. The plane of the Milky Way runs horizontally through the middle, and the Galactic centre line of sight is the middle of the map. Red–pink colours show increasing Galactic magnetic field strengths pointing towards the Earth. Blue–purple colours show increasing Galactic magnetic field strengths pointing away from the Earth. The background shows the signal reconstructed using sources outside our Galaxy. The points show the current measurements for pulsars. The squares show the measurements from this work using LOFAR pulsar observations.
[nba_button type="button-outline" size="small" link="https://ui.adsabs.harvard.edu/abs/2018A%26A...613A..58V"]Read the paper[/nba_button]
The polarization properties of radio sources at very low frequencies (<200 MHz) have not been widely measured, but the new generation of low-frequency radio telescopes, including the Low Frequency Array (LOFAR: a Square Kilometre Array Low pathfinder), now gives us the opportunity to investigate these properties. In this paper, we report on the preliminary development of a data reduction pipeline to carry out polarization processing and Faraday tomography for data from the LOFAR Two-meter Sky Survey (LOTSS) and present the results of this pipeline from the LOTSS preliminary data release region. We have produced a catalog of 92 polarized radio sources at 150 MHz at 4.’3 resolution and 1 mJy rms sensitivity. We estimate a lower limit to the polarized source surface density at 150 MHz, with our resolution and sensitivity, of 1 source per 6.2 square degrees. We find that our Faraday depth measurements are in agreement with previous measurements and have significantly smaller errors. Most of our sources show significant depolarization compared to 1.4 GHz, but there is a small population of sources with low depolarization indicating that their polarized emission is highly localized in Faraday depth. We predict that an extension of this work to the full LOTSS data would detect at least 3400 polarized sources using the same methods.
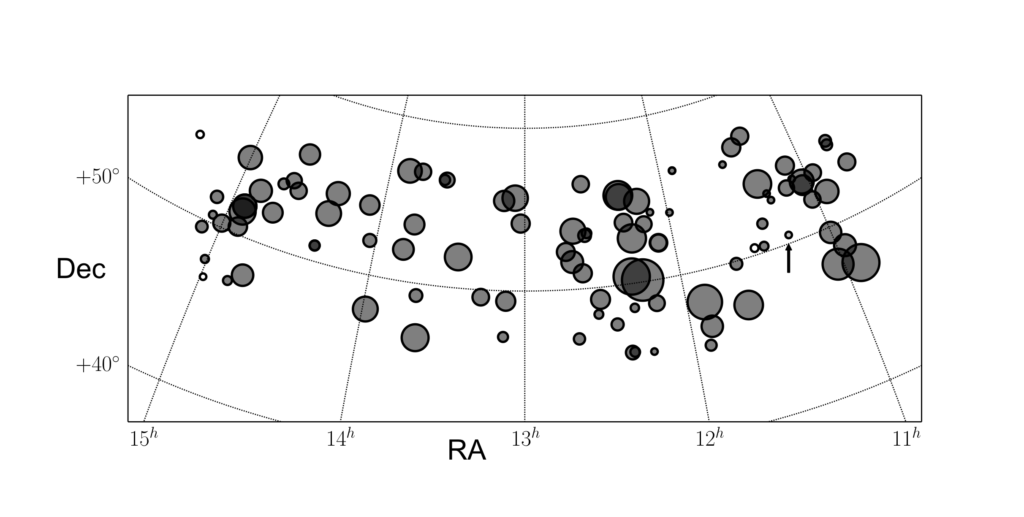
Positions and Faraday depths of all polarized sources in the catalog. The size of each symbol is proportional to the magnitude of Faraday depth (sources with |φ| < 5 rad m−2 are set equal in size to 5 rad m−2; the largest circle has RM=32 rad m−2). Open and filled circles represent negative and positive Faraday depths, respectively. The single pulsar in the catalog (PSR B1112+50) is marked with an arrow.
[nba_button type="button-outline" size="small" link="https://ui.adsabs.harvard.edu/abs/2017A%26A...597A..98V"]Read the paper[/nba_button]
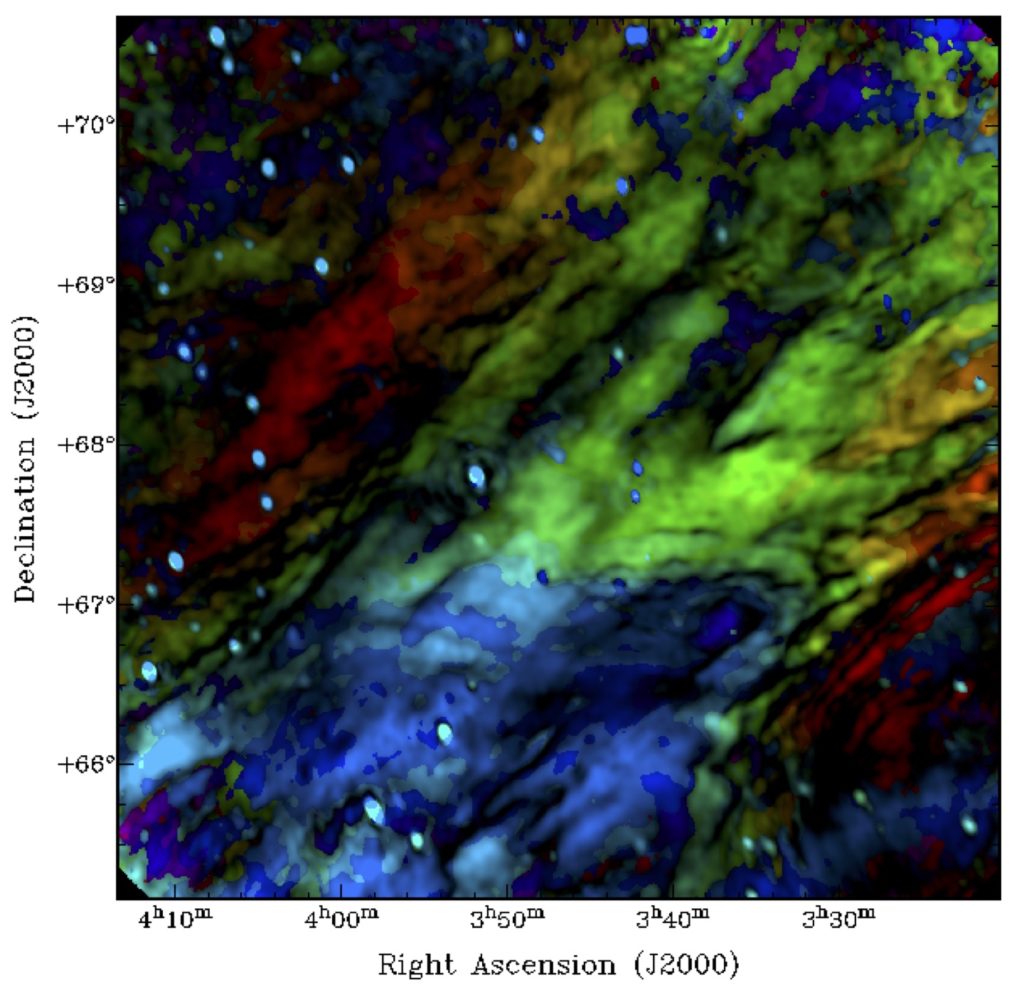
We imaged a 5×5-degree region centred on the nearby galaxy IC 342 using LOFAR high-band antenna observations in the frequency range 115-178 MHz at 4′.5×3′.8 resolution. Faraday tomography was used to identify the Galactic polarized synchrotron at various Faraday depths (different amounts of Faraday rotation). This shows a rich structure, with clear detections of two polarized features that extend over most of the field of view. We conclude that the observed polarized emission is Faraday thin, and propose that the emission originates from two mostly neutral clouds in the local ISM. Using maps of the local ISM to estimate the distances to these clouds, we modelled the Faraday rotation for this line of sight and deduced approximate line-of-sight local interstellar medium magnetic field strengths between -0.86 and+0.12 μG (where negative/positive values point away from/towards the Earth).
[nba_col_grid][nba_col_1_2]
 [/nba_col_1_2][nba_col_1_2]
An image of the Faraday cube of the IC342 field made using LOFAR data covering the frequency range 115 to 178 MHz. The color corresponds to the Faraday depth of the peak in rad m-2 (red is -3; green is around -1; light blue is around 0; purple is +2), and the brightness corresponds to the polarized flux density. The most striking feature is the blue region in the lower left. It is surrounded on three sides by green emission with a sharp boundary, but the intensity is smooth across this boundary. This indicates that the emission comes from a single continuous region but there is a sharp enhancement in the Faraday rotation inside this blue region. The light blue point sources are artefacts caused by instrumental polarization leakage. [/nba_col_1_2][/nba_col_grid]
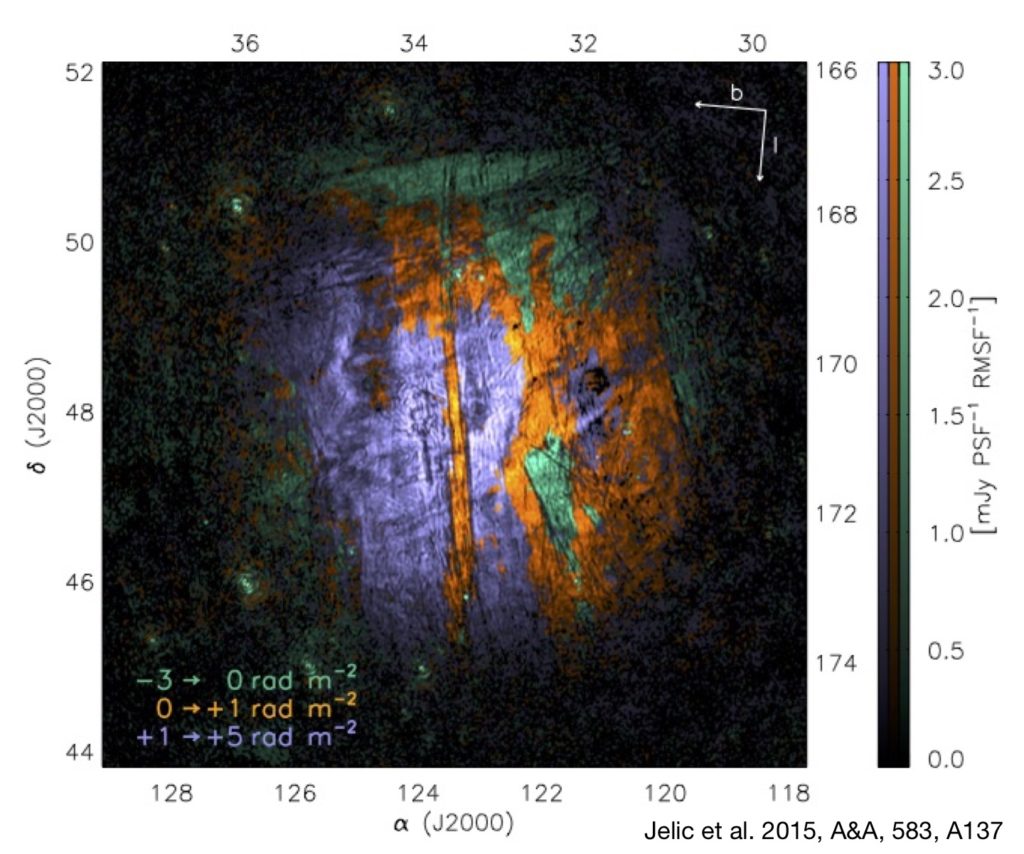
[nba_button type="button-outline" size="small" link="https://ui.adsabs.harvard.edu/abs/2015A%26A...583A.137J/abstract"]Read the paper[/nba_button]
We characterized linear polarization structures in LOFAR observations of the interstellar medium (ISM) in the 3C 196 field, one of the primary fields of the LOFAR-Epoch of Reionization key science project. The high band antennas (HBA) of LOFAR were used to image this region and rotation measure (RM) synthesis was applied to unravel the distribution of polarized structures in Faraday depth. The polarized Galactic emission covers the range from -3 to +8 rad m-2 in Faraday depth. The most interesting morphological feature is a strikingly straight filament at a Faraday depth of +0.5 rad m-2 running from north to south, right through the centre of the field and parallel to the Galactic plane, plus a system of linear depolarization canals. We used the Westerbork Synthesis Radio Telescope (WSRT) at 350 MHz to image the same region. For the first time, we see some common morphology in the RM cubes made using LOFAR at 150 MHz and WSRT. There is no indication of diffuse emission in total intensity in the interferometric data, in line with results at higher frequencies and previous LOFAR observations. We determined the mean line-of-sight magnetic field component to be 0.3 ± 0.1 μG, and its spatial variation across the field is 0.1 μG. The filamentary structure is probably an ionized filament in the ISM, located somewhere within the Local Bubble. This filamentary structure shows an excess in thermal electron density (> 6.2 μG cm-3) compared to its surroundings.
[nba_col_grid][nba_col_1_2]
 [/nba_col_1_2][nba_col_1_2]
A colour composite image of polarized radio emission from our Galaxy, detected using the LOFAR radio telescope at 115-178 MHz, in the vicinity of the quasar 3C 196. Different colors show emission detected at different Faraday depths. [/nba_col_1_2][/nba_col_grid]
[nba_button type="button-outline" size="small" link="https://ui.adsabs.harvard.edu/abs/2013A%26A...558A..72I/abstract"]Read the paper[/nba_button]
The characteristic outer scale of turbulence (i.e. the scale at which the dominant source of turbulence injects energy to the interstellar medium) and the ratio of the random to ordered components of the magnetic field are key parameters to characterise magnetic turbulence in the interstellar gas, which affects the propagation of cosmic rays within the Galaxy. We provided new constraints to those two parameters.
We present the first LOw Frequency ARray (LOFAR) detection and imaging of the Galactic diffuse synchrotron emission – in the ‘Fan region’ at 146-174 MHz and at 80×70-arcsecond resolution. We detect multi-scale fluctuations in the Galactic synchrotron emission and compute their power spectrum, also for earlier GMRT and WSRT observations. The power spectrum displays a power-law behaviour for scales between 100 and 8 arcmins with a slope α = -1.84 ± 0.19. We find an upper limit of ~20 pc for the outer scale of the magnetic interstellar turbulence toward the Fan region, in agreement with previous estimates in the literature. We also find variation in the ratio of ordered-to-random field strengths as a function of Galactic coordinates, 0.3-0.5, supporting different turbulent regimes.